IBMA (Image-based meta-analysis)
With statistical maps of different datasets tested using same analysis pipeline, and the demography of each sample, users can perform meta-analysis to merge the multisite statistics using image-based or matrix-based meta-analysis. We have implemented Stouffer’s z-score method, Fisher’s method, fixed/mixed effects model, Worsley and Friston’s method and Nichols’ method.
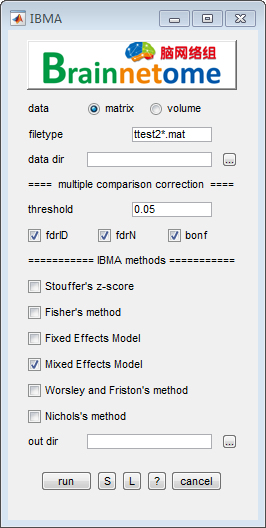
- data: matrix
- filetype: files in the filetype will be searched in input directories.
- data dir: directory where all
ttest2*.matresults are stored.
- data: volume
- center info: number of subjects for different centers. A csv format table is required. N1 and N2 is the number of subjects in each group.
center N1 N2 ttest2_center1_a_vs_b 40 39 ttest2_center2_a_vs_b 38 37
mask: could be whole brain mask or gray matter mask.
id index: identifier to find unique string for each subject
filetype: files in the filetype will be searched in input directories.
data dir: directories can be input either using a
*.txtfile or spm select window.
- Multiple comparison correction methods (voxel-wise)
- threshold: the level of MULCC
- fdrID: false discovery rate (independent input)
- fdrN: false discovery rate (inputs not independent)
- bonf: Bonferroni correction for family wise error rate
- out dir: output directory for saving results.
- Buttons:
- S: Save parameters of the current panel to a
*.matfile. The*.matcan be further loaded for the panel or be used in a script processing. - L: Load parameters from
*.matfor the current panel. - ?: Help information.
- S: Save parameters of the current panel to a
- References:
- Stouffer’s z-score
Stouffer, S.A., Suchman, E.A., DeVinney, L.C., Star, S.A. and Williams Jr, R.M., 1949. The American soldier: Adjustment during army life.(Studies in social psychology in World War II), Vol. 1. Princeton University Press, Princeton,.
- Fisher
Fisher, R.A. (1925). Statistical Methods for Research Workers. Oliver and Boyd (Edinburgh). ISBN 0-05-002170-2.
- Fixed/mixed Effects Model
Hedges, L.V. (1992). Meta-Analysis. Journal of Educational and Behavioral Statistics. 17(4), 279-296. doi: 10.3102/10769986017004279.
Konstantopoulos, S. (2006). Fixed and mixed effects models in meta-analysis. Iza Discussion Papers.
- Worsley and Friston’s method
Worsley, K.J., and Friston, K.J. (2000). A test for a conjunction. Statistics & Probability Letters. 47(2), 135-140. doi: 10.1016/S0167-7152(99)00149-2.
- Nichols’s method
Nichols, T., Brett, M., Andersson, J., Wager, T., and Poline, J.B. (2005). Valid conjunction inference with the minimum statistic. Neuroimage. 25(3), 653-660. doi: 10.1016/j.neuroimage.2004.12.005.
Salimi-Khorshidi G, Smith SM, Keltner JR, Wager TD, Nichols TE. Meta-analysis of neuroimaging data: a comparison of image-based and coordinate-based pooling of studies. Neuroimage 2009; 45(3): 810-23.
Benjamini Y, Hochberg Y. Controlling the False Discovery Rate - a Practical and Powerful Approach to Multiple Testing. J Roy Stat Soc B Met 1995; 57(1): 289-300.
Benjamini Y, Yekutieli D. The control of the false discovery rate in multiple testing under dependency. Ann Stat 2001; 29(4): 1165-88.
Lazar NA, Luna B, Sweeney JA, Eddy WF. Combining brains: a survey of methods for statistical pooling of information. Neuroimage 2002; 16(2): 538-50.