Slice Mapping
This function is used to visualize 3D volume by cut it into no more than 19 slices. All slices will be displayed in a single window, overlapped with the background volume. We can choose the range of displaying if necessary.
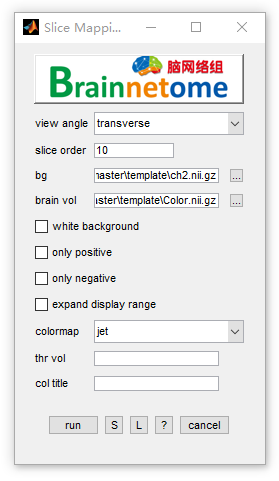
- view angle: direction of slice viewing
- slice order: choose which slice(s) to display
- bg: directory of backgroud volume file
- brain vol: directory of displayed volume file
- white background: the background of the display window will be white if checked, otherwise it will be black.
- only positive: only voxels with positive value will be displayed if checked
- only negative: only voxels with negetive value will be displayed if checked
- expand display range: if checked, the voxels with value out of range will be displayed as the threshold value
- colormap: choose the color map of slice viewing
- thr vol: set the range to generate a mask for input volume, seperated by ‘,’.
- col title: title of the colorbar
- Buttons:
- S: Save parameters of the current panel to a
*.matfile. The*.matcan be further loaded for the panel or be used in a script processing. - L: Load parameters from
*.matfor the current panel. - ?: Help information.
- S: Save parameters of the current panel to a