FCD/FCS
FCD is short for Functional Connectivity Density and FCS is short for Functional Connectivity Strength.
A region growing algorithm was carried out to measure the local degree of each voxel under a certain threshold of Pearson’s correlation. FCD in BRANT has been implemented to calculate the local FCD (lFCD), the global FCD (gFCD) and the long-range FCD (lrFCD) at one time. The lFCD of each voxel represents the number of spatially connected voxels defined by the region growing algorithm, while the gFCD, which is also referred to as the voxel-wise degree centrality, represents the number of voxels that have higher-than-threshold correlation with the seed voxel. The lrFCD is calculated as the gFCD subtracted the lFCD.
Functional connectivity strength (FCS) measures the amount of information a node receives across whole graph or within a distance. Similar to FCD, the voxel-wise Pearson’s correlation coefficients are firstly calculated in parallel and then Fisher-z transformed to improve normality. For each voxel, the FCS is calculated as the sum of connectivity that exceeds a given threshold divided by the number of voxels.
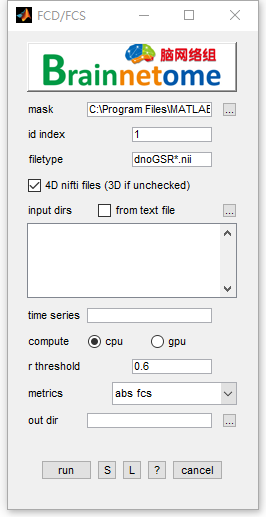
- mask: could be whole brain mask or gray matter mask.
- id index: identifier to find unique string for each subject
- filetype: files in the filetype will be searched in input directories.
- 4D nifti files: if the input data is 4D, check this item. Otherwise uncheck.
- input dirs: directories can be input either using a
*.txtfile or spm select window. - time series: choose the time series to calculate, seperated by ‘,’.
- compute: use OPENCL supported CPU or GPU to calculate FCD
- r threshold: threshold of correlation (to binarize functional connectivity and sum up)
- metrics:
- fcd - functional connectivity density, calculate global and region grow defined degree
- fcs - functional connectivity strength, calculate global-wise sum/mean of above threshold intensity
- fcs abs - absolute functional connectivity strength, firstly convert FC map to absolute value and calculate global-wise sum/mean of above threshold intensity
- out dir: output directory for saving results.
- Buttons:
- S: Save parameters of the current panel to a
*.matfile. The*.matcan be further loaded for the panel or be used in a script processing. - L: Load parameters from
*.matfor the current panel. - ?: Help information.
- S: Save parameters of the current panel to a
- Output files:
- Raw:
- gfcd(global fcd): count the number of voxels of voxel to whole brain correlation (rho > threshold)
- lfcd(local fcd): count the number of voxels of voxel to neighbour voxels’ correlation (rho > threshold, with region grow method)
- lrfcd(long-range fcd): gfcd - lfcd
- fcs_sum: sum of above threshold voxels’ intensity
- fcs_ave: mean of above threshold voxels’ intensity
- Normalized:
- gfcd: gfcd(Raw) divided by mean value of gfcd(Raw)
- lfcd: lfcd(Raw) divided by mean value of lfcd(Raw)
- lrfcd: lrfcd(Raw) divided by mean value of lrfcd(Raw)
- fcs_sum_nor: fcs_sum(Raw) divided by mean value of fcs_sum(Raw)
- fcs_ave_nor: fcs_ave(Raw) divided by mean value of fcs_ave(Raw)
- References:
- Tomasi, D., & Volkow, N. D. (2010). Functional connectivity density mapping. Proceedings of the National Academy of Sciences of the United States of America, 107(21), 9885-90.
- Craddock R, Clark D. Optimized implementations of voxel-wise degree centrality and local functional connectivity density mapping in AFNI. GigaScience 2016; 5(suppl_1): 4-6.
- Qin W, Xuan Y, Liu Y, Jiang T, Yu C. Functional Connectivity Density in Congenitally and Late Blind Subjects. Cereb Cortex 2014; 25(9): 2507-16.